Email Reports
Benchmark offers different types of email reporting: a Performance Overview, the Email Report page, and individual email reporting.
The Performance Overview provides a comprehensive view of your emails' performance, helping you track key metrics and optimize future campaigns.
The Email Report page lists the emails you sent. Here, you'll see how each email performed. To view an individual email report, click on the email name. Within the individual email report, you will be able to see all metrics related to the email, such as opens, clicks, bounce rate, and more.
Performance Overview Page
The Performance Overview page provides a comprehensive view of your account's email performance, helping you track key metrics and optimize future campaigns. You can filter your results by 30, 60, or 90 days.

Here are some of the metrics you'll see:
- Filter email performance data by:
- Last 90 days
- Last 60 days
- Last 30 days
- Total Emails Sent
- Open rate
- Click rate
- Hard Bounces
- Soft Bounces
- Unsubscribes
- Spam Complaints
Open Rates by Delivery Time
- Analyze how many contacts open emails during different periods. Helps optimize future campaigns for better engagement.
- Morning (4 AM - 10 AM)
- Afternoon (10 AM - 4 PM)
- Evening (4 PM - 10 PM)
- Night. (10 PM - 4 AM)
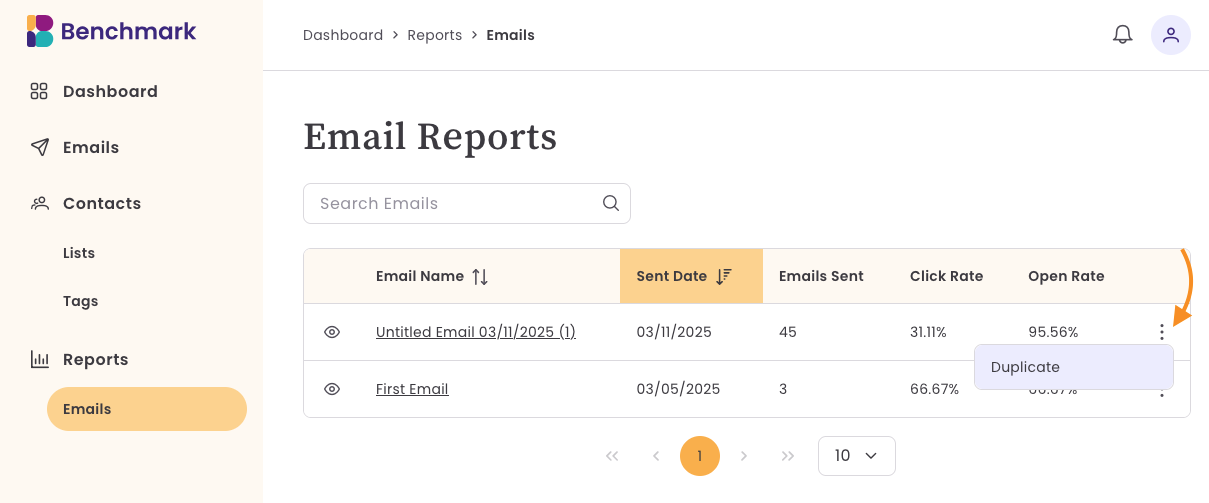
Email Reports Page
The Email Reports page lists the emails sent, along with individual details of the email.

Here you'll see:
- Name of email sent. Click on the email name to see the full report for a specific email.
- The date the email was sent
- Total Emails sent
- Click rate
- Open rate
- More Options menu.
- Duplicate an Email
-
To duplicate an email, click the More Options button (3 dots).
-

Individual Email Reports
There are a few ways to access your email's reports.
From the Email Reports page.
Locate your email and click on the name of the email.

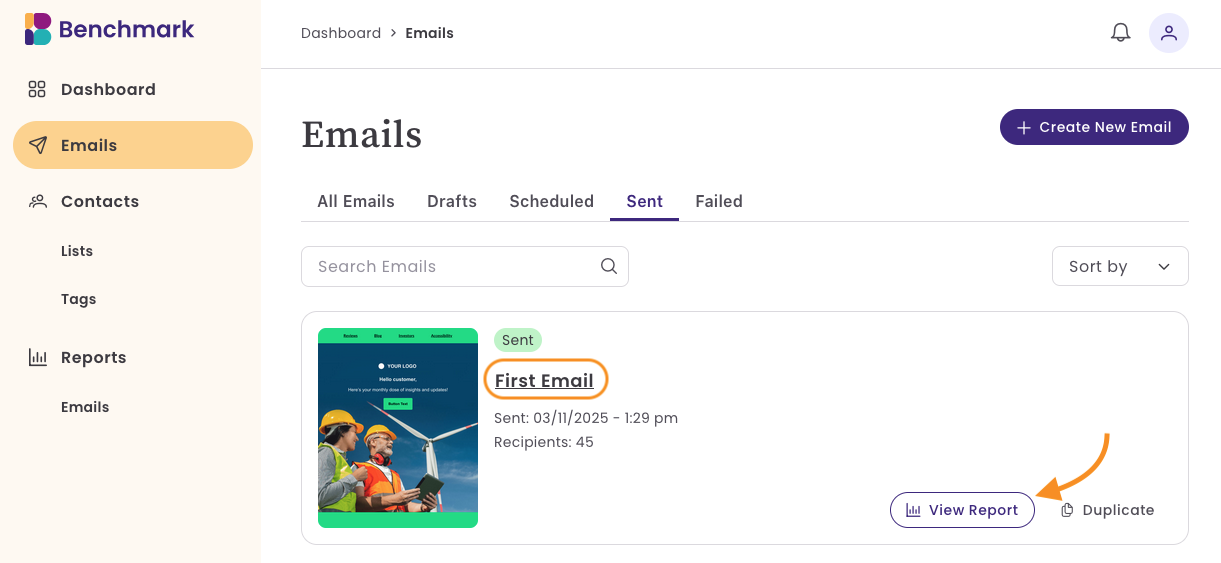
Emails Dashboard
- Select the Sent folder.
-
Locate your email and click on the email name or the View Report option.

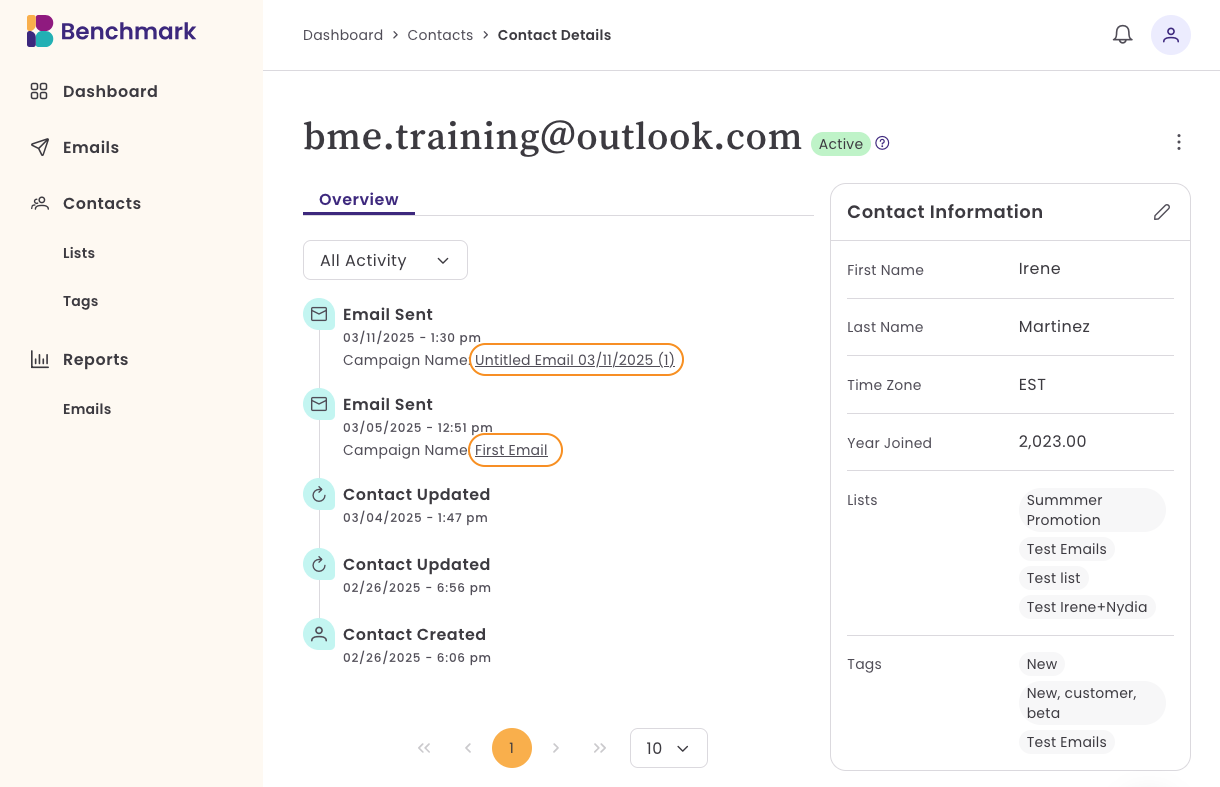
From a Contact's activity.
-
Open the contact record. If an email was sent to the contact, you'll see it within their activity report. Click on the email name to open the email report.

Now that you know how to access an email report, here are the details on an individual email report page.

- Email Name
- Date Sent
- Subject Line
- To (recipients): Lists the email was sent to
Performance Funnel

Complete summary of how your email performed.
Here you will find.
- Emails Sent
- Opens
- Clicks
Open Rate: includes the percentage of contacts who opened. Click on the total number of opens to see the contacts who opened.
Click Rate: provides the click rate of your email, along with the contacts that did not click. Click on the total clicks or non-clicks to view or manage the contacts.
Bounce Rate: This provides the total number of emails delivered. It is made up of the email addresses that bounced. Here, you can see hard bounces and soft bounces. Click on the total number to see and manage the contacts.
Link Activity
The Link Activity lists the links used within your emails.

You can see the link Appearance Order. The appearance order refers to the placement of your link within your email. One (1) is located at the top of the email, and higher numbers indicate lower email placement.
Managing Clicks
You can click on the Unique Click total to view and manage contacts who clicked on a specific link.

Total Clicks
- The total number of times links in your email were clicked. If a recipient clicks the same link multiple times, each click is counted separately.
Unique Clicks
- The number of distinct contacts who clicked on a link in your email. Even if a contact clicks multiple times, they are only counted once.
Example:
If John clicks a link 3 times and Mary clicks it once, you would see:
Total Clicks = 4
Unique Clicks = 2 (since only John and Mary clicked)
Why It Matters:
Total Clicks show engagement intensity—how often contacts interact with your links.
Unique Clicks give a clearer picture of how many individuals engage with your content.
First 24 hours Engagement Graph
The Engagement Graph shows how your email performed with opens and clicks. You can filter the graph by a 24-hour period and a week. You'll see a quick summary of when your email reached peak engagement.
Your Benchmarks
In this section, you'll see the average Unique Opens and Clicks for this email and the average for your account in the last 90 days.
